An echo bubble study interpretation can significantly improve the evaluation process of an echocardiogram. This involves the rapid amalgamation of air with a saline solution, producing microbubbles. These microbubbles are subsequently administered into a patient’s arm vein via an intravenous injection. The echocardiogram captures these bubbles as they advance from the vein into the right hemisphere of the heart.
Under normal circumstances in echo bubble study interpretation, these microbubbles get filtered out in the lungs, ceasing their journey. However, their appearance in the left atrium of the heart implies the presence of a defect – typically an Atrial Septal Defect (ASD) or a Patent Foramen Ovale (PFO). These defects signify an opening between the two superior heart chambers, namely, the left and right atria.
7 INDICATIONS FOR ECHO BUBBLE STUDY INTERPRETATION
1. Identifying Shunts
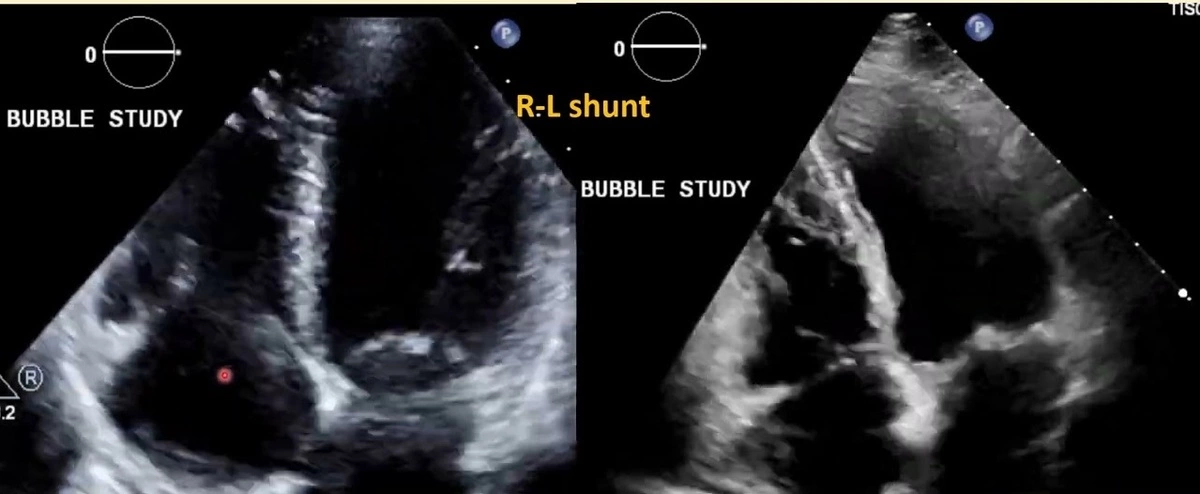
Generally, the visualization of micro-bubbles on the left side of the heart post their appearance in the right heart chambers signifies a positive shunt interpretation in the echo bubble study.
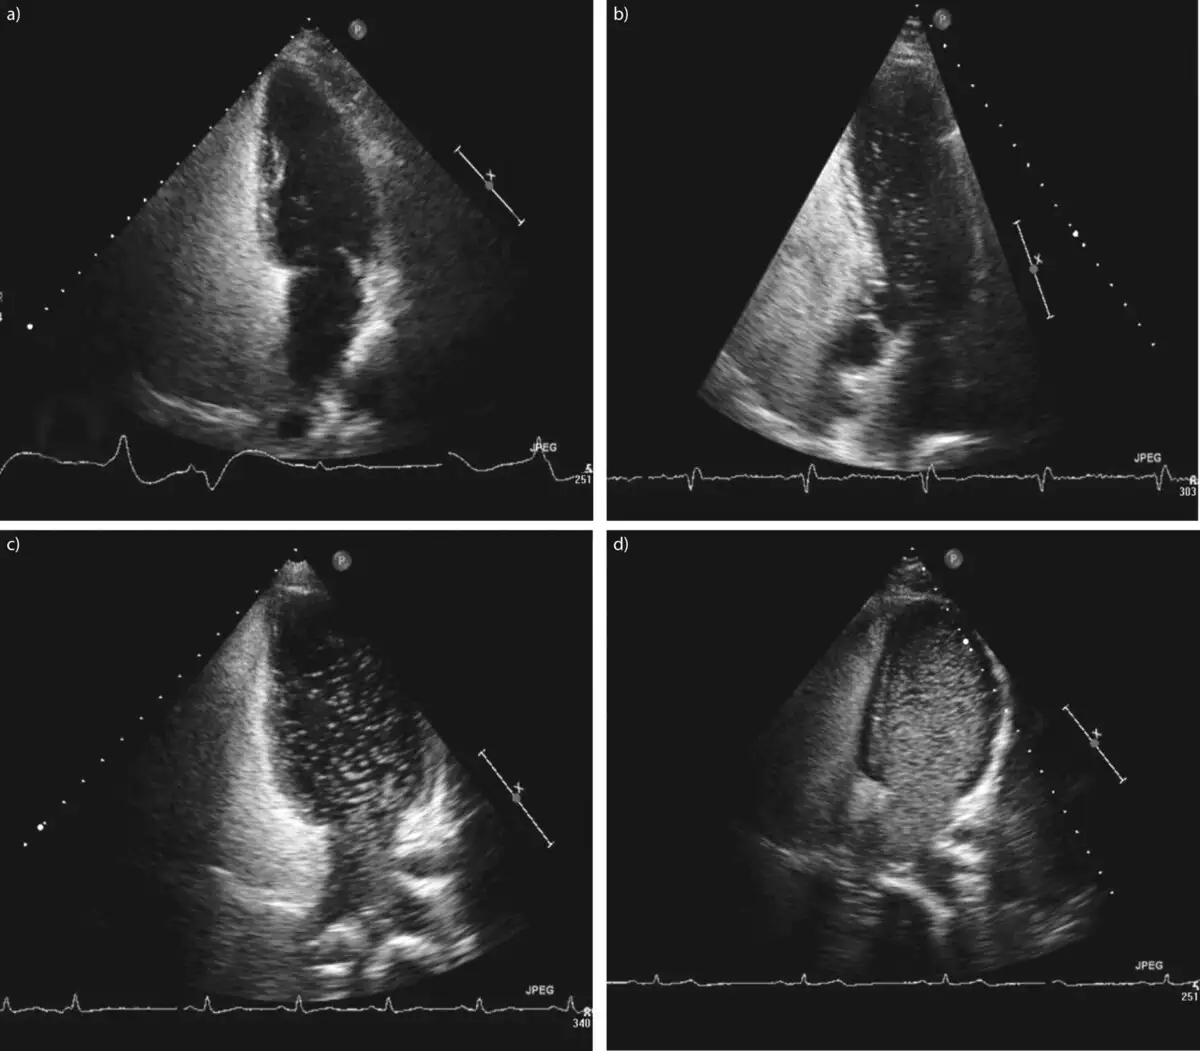
Primarily, the apical four-chamber view is utilized. However, the parasternal short-axis view at the atrial septum level (aortic valve level) or a subcostal four-chamber view may also be employed.


ASD/PFO
In instances of ASD or PFO, the bubbles should ideally emerge on the left side of the heart within the first 3 to 4 cardiac cycles during the echo bubble study interpretation.
If no bubbles materialize on the left side, the patient is instructed to perform the Valsalva maneuver which prompts the opening of the PFO leading to bubble emergence on the left side. Failure to show transient leftward bowing of the atrial septum with Valsalva release indicates the need to repeat the maneuver.
During TEE, proper Valsalva typically is hard to perform. Most practitioners now utilize external liver compression followed by release causing a sudden rise in IVC flow towards RA, which mimics the Valsalva release. Some practitioners employ coughing.
2. Diagnosing Pulmonary Arteriovenous Malformations (PAVM’s)
In cases of pulmonary arteriovenous malformations (PAVM’s), signifying abnormal dilated vessels causing a right-to-left shunt between pulmonary and systemic circulation, the micro-bubbles might appear in the left side of the heart after 5 or more cardiac cycles, termed “late bubbles”.
In hepatopulmonary syndrome, PAVMs are microscopic and won’t be visible on CTPA. The agitated saline can be used as a zero radiation technique for screening family members of patients with Osler-Weber-Rendu syndrome.
3. Echo Bubble Study Interpretation for Persistent Left Superior Vena Cava
When a dilated coronary sinus indicates a persistent left superior vena cava, the cannula is inserted in the left arm, with agitated saline being injected from the same arm. Imaging is preferably done through the parasternal long-axis view, with M-mode being beneficial for improved temporal resolution.
4. Enhancing TR Signal
The TR signal by CW may occasionally be suboptimal and harder to interpret. In such scenarios, injecting agitated saline and capturing CW of TR intensifies the signal visibility and measurability.
5. Outlining Right Heart Borders and Masses
At times, in suboptimal views, the RV borders may not be clearly visible. Injecting agitated saline can help spotlight RV borders for precise measurements, delineate RV free wall, and identify any mass or other abnormalities inside the RV cavity.
6. Assisting in Imaging Pulmonary Arteries
Agitated saline can aid in correctly determining pulmonary artery size, as well as sub/supravalvular area if the image is suboptimal. It can also highlight thrombi and masses.
7. Echo-Guided Pericardiocentesis and Central Venous Line Control after Insertion
In pericardiocentesis, agitated saline is used to distinguish if puncture is inside the pericardium or a cardiac chamber. Similarly, while using a central venous line post-insertion, the appearance of contrast immediately in RA signifies arterial cannulation, indicative of the catheter coiling.
Echo Bubble Study Interpretation: A Deep Dive into a Vital Diagnostic Tool
Introduction to Echocardiography
Echocardiography, commonly known as an “echo,” is a non-invasive, ultrasound-based procedure used to capture images of the heart. This vital medical tool lets professionals see how well your heart and its valves are functioning. But have you ever wondered about the interpretation of these complex images? Well, let’s delve right into it!
The Magic Behind Echocardiography
Echo involves the use of sound waves to create moving pictures of your heart. Now, you might be asking, “How does that even work?” It’s actually simpler than you would think, even if it sounds like it involves a metaphorical rabbit out of a magician’s hat!
The Science Behind ‘Echo’
Echocardiography uses sound waves that bounce off your heart and produce echoes. These echoes are then translated into dynamic visual images that reflect the heart’s size, shape, and how well it’s pumping blood, not unlike a speedy, internal courier service.
Enter the Echo Bubble Study
An important and often required part of this is called the echo bubble study. Traditional echocardiography can show structural and functional status, but what if we want to delve a little deeper?
Echo Bubble Study: The What and Why
The echo bubble study, also known as bubble echocardiography, introduces agitated saline into the blood, resulting in tiny bubbles. These little guys can then be traced as they travel through the circulation, playing the role of undercover agents in a medical action-thriller.
The Data Unveiled by the Bubble
These bubbles offer precious clues about potential cardiovascular conditions such as intracardiac shunts, pulmonary arteriovenous malformations, and more. “How valuable can tiny bubbles be?” you might ask. Well, let’s have a deeper dive!
Interpreting an Echo Bubble Study
Interpretation of this specialist study is an art that marries science and skill. It requires a trained eye to read and understand what these bubbles signify.
Echo Bubble Study: Bringing the Hidden to Light
Seeing bubbles in certain parts of the heart during the echo bubble study can indicate conditions that would otherwise remain hidden. The interpreter needs to know precisely where to look and when, making them a sort of Sherlock of the medical world.
Key Indicators during Interpretation
Key indicators include bubble quantity and timing of appearance. Too many bubbles or bubbles appearing too early can indicate certain abnormalities. “Early arrival” or higher density of bubbles can point to shunts or malformations, respectively, that need immediate attention. Think of it as reading an unusual Morse code secreted by your own body!
Critical Role of the Echo Bubble Study in Diagnosis
Armed with this information, healthcare providers can make a targeted diagnosis and develop an effective treatment plan.
Unlocking Treatment Options
Interpreting an echo bubble study helps doctors recommend various therapies or interventions, establishing the path toward resolving any ailments they’ve discovered.
Conclusion
The echo bubble study, though it might sound peculiar, plays an immense and critical role in assessing and combating heart diseases. So, the next time you come across this term, you can picture those little bright detectives hard at work, tracing routes and deciphering signs within your heart.
And remember, as mystifying as the journey of the tiny bubbles may seem, each bubble carries with it the potential to unlock a healthier you. Isn’t that quite a bubble to burst? Remember, in the realm of medical diagnostics, even the tiniest element can bring a sea change. And an echo bubble study interpretation is one such powerful arsenal that assists in this quest. With this tool, we can demystify the heart, one echo bubble study at a time.
It’s safe to say, the echo bubble study truly shines as the hero in the saga of heart-health diagnosis and interpretation.
Read also: Holter monitor results example